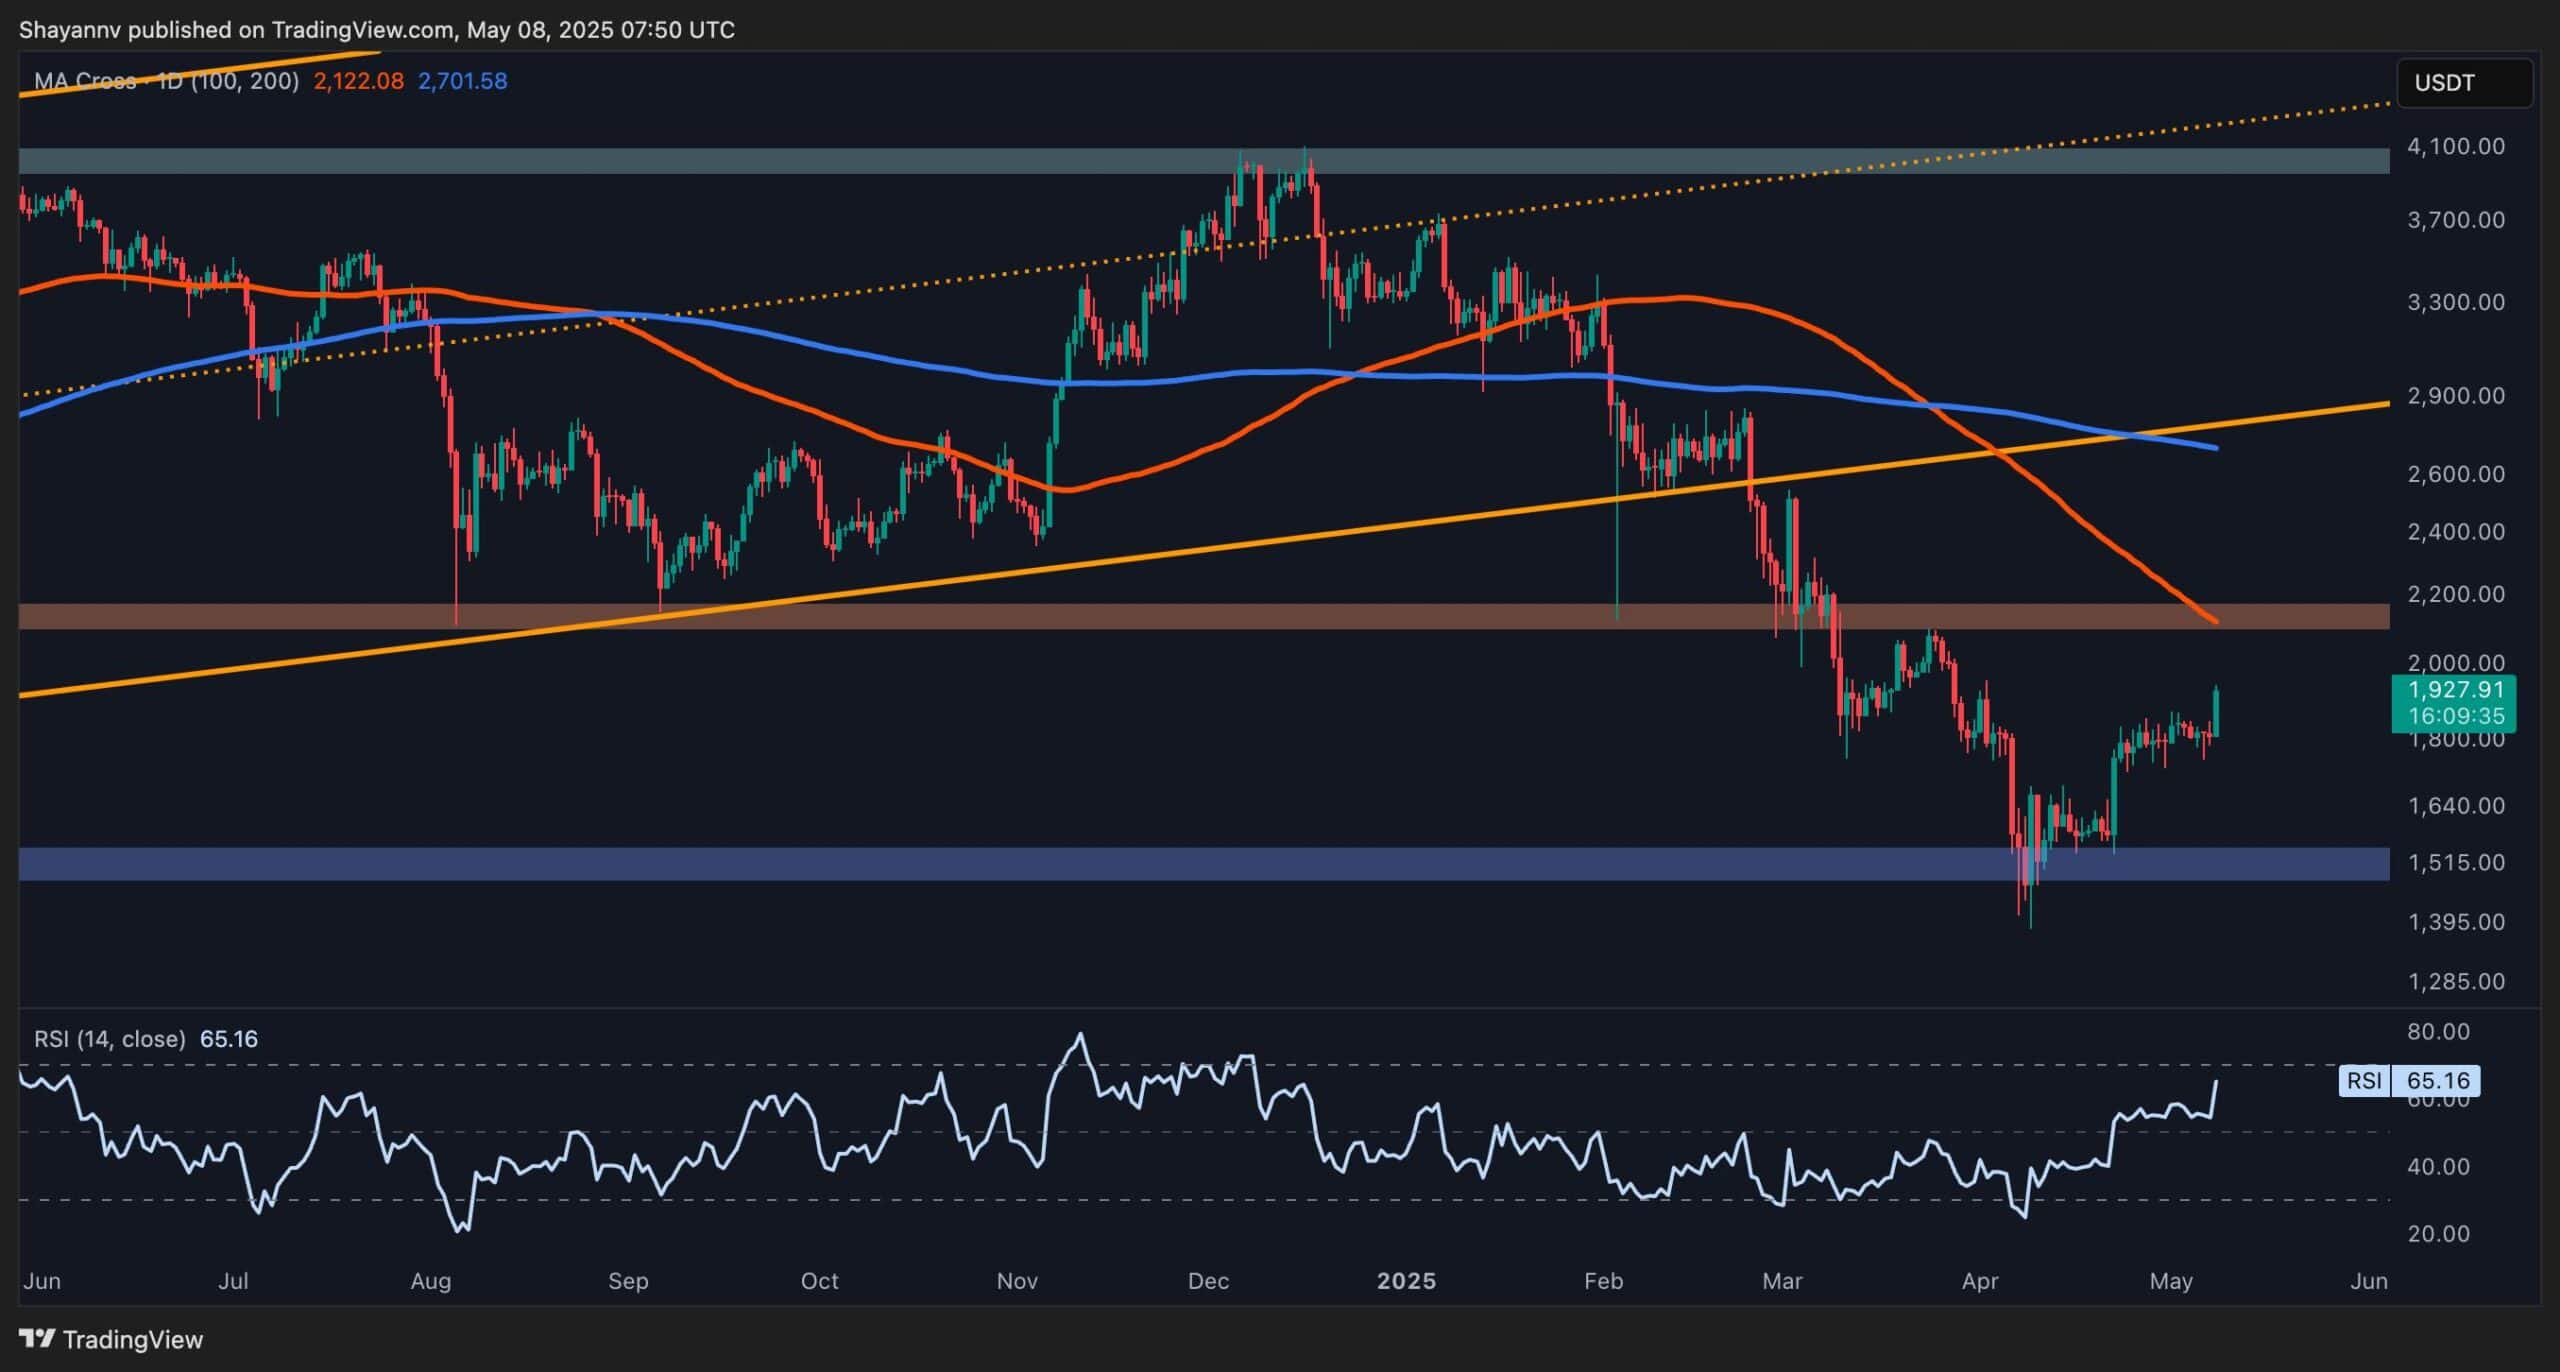
Following a notable increase in demand, Ethereum surged past the $1.8K resistance level. The price is now expected to extend its bullish trend toward the significant $2.1K resistance region, which aligns with the 100-day moving average.
Technical Analysis
The Daily Chart
A surge in buying activity near the critical $1.5K support level triggered a strong upward move, propelling Ethereum above the key $1.8K resistance zone, an encouraging bullish signal. This breakout raises the question of whether a fresh bullish phase has begun. However, ETH now faces a substantial resistance region ahead, marked by the $2.1K level, which coincides with the 100-day moving average.
As such, the asset is likely to continue its upward trajectory toward this resistance. A temporary consolidation near $2.1K may follow, allowing the market to absorb supply. If buyers manage to breach this level decisively, the next target will likely be the $2.5K mark.
The 4-Hour Chart
On the 4-hour timeframe, Ethereum confirmed a bullish market structure shift with a breakout above a short-term ascending flag pattern at $1.8K, an area previously established as a significant swing low. This breakout sparked a sharp surge in its price.
However, ETH is now approaching the critical $2.1K resistance level, which also aligns with a major prior swing high. In the near term, the price is expected to approach this level with increased buying pressure. Should buyers succeed in pushing above it, the next bullish target would be $2.5K. Conversely, a rejection at this resistance could result in a consolidation phase within the $1.8K–$2.1K range.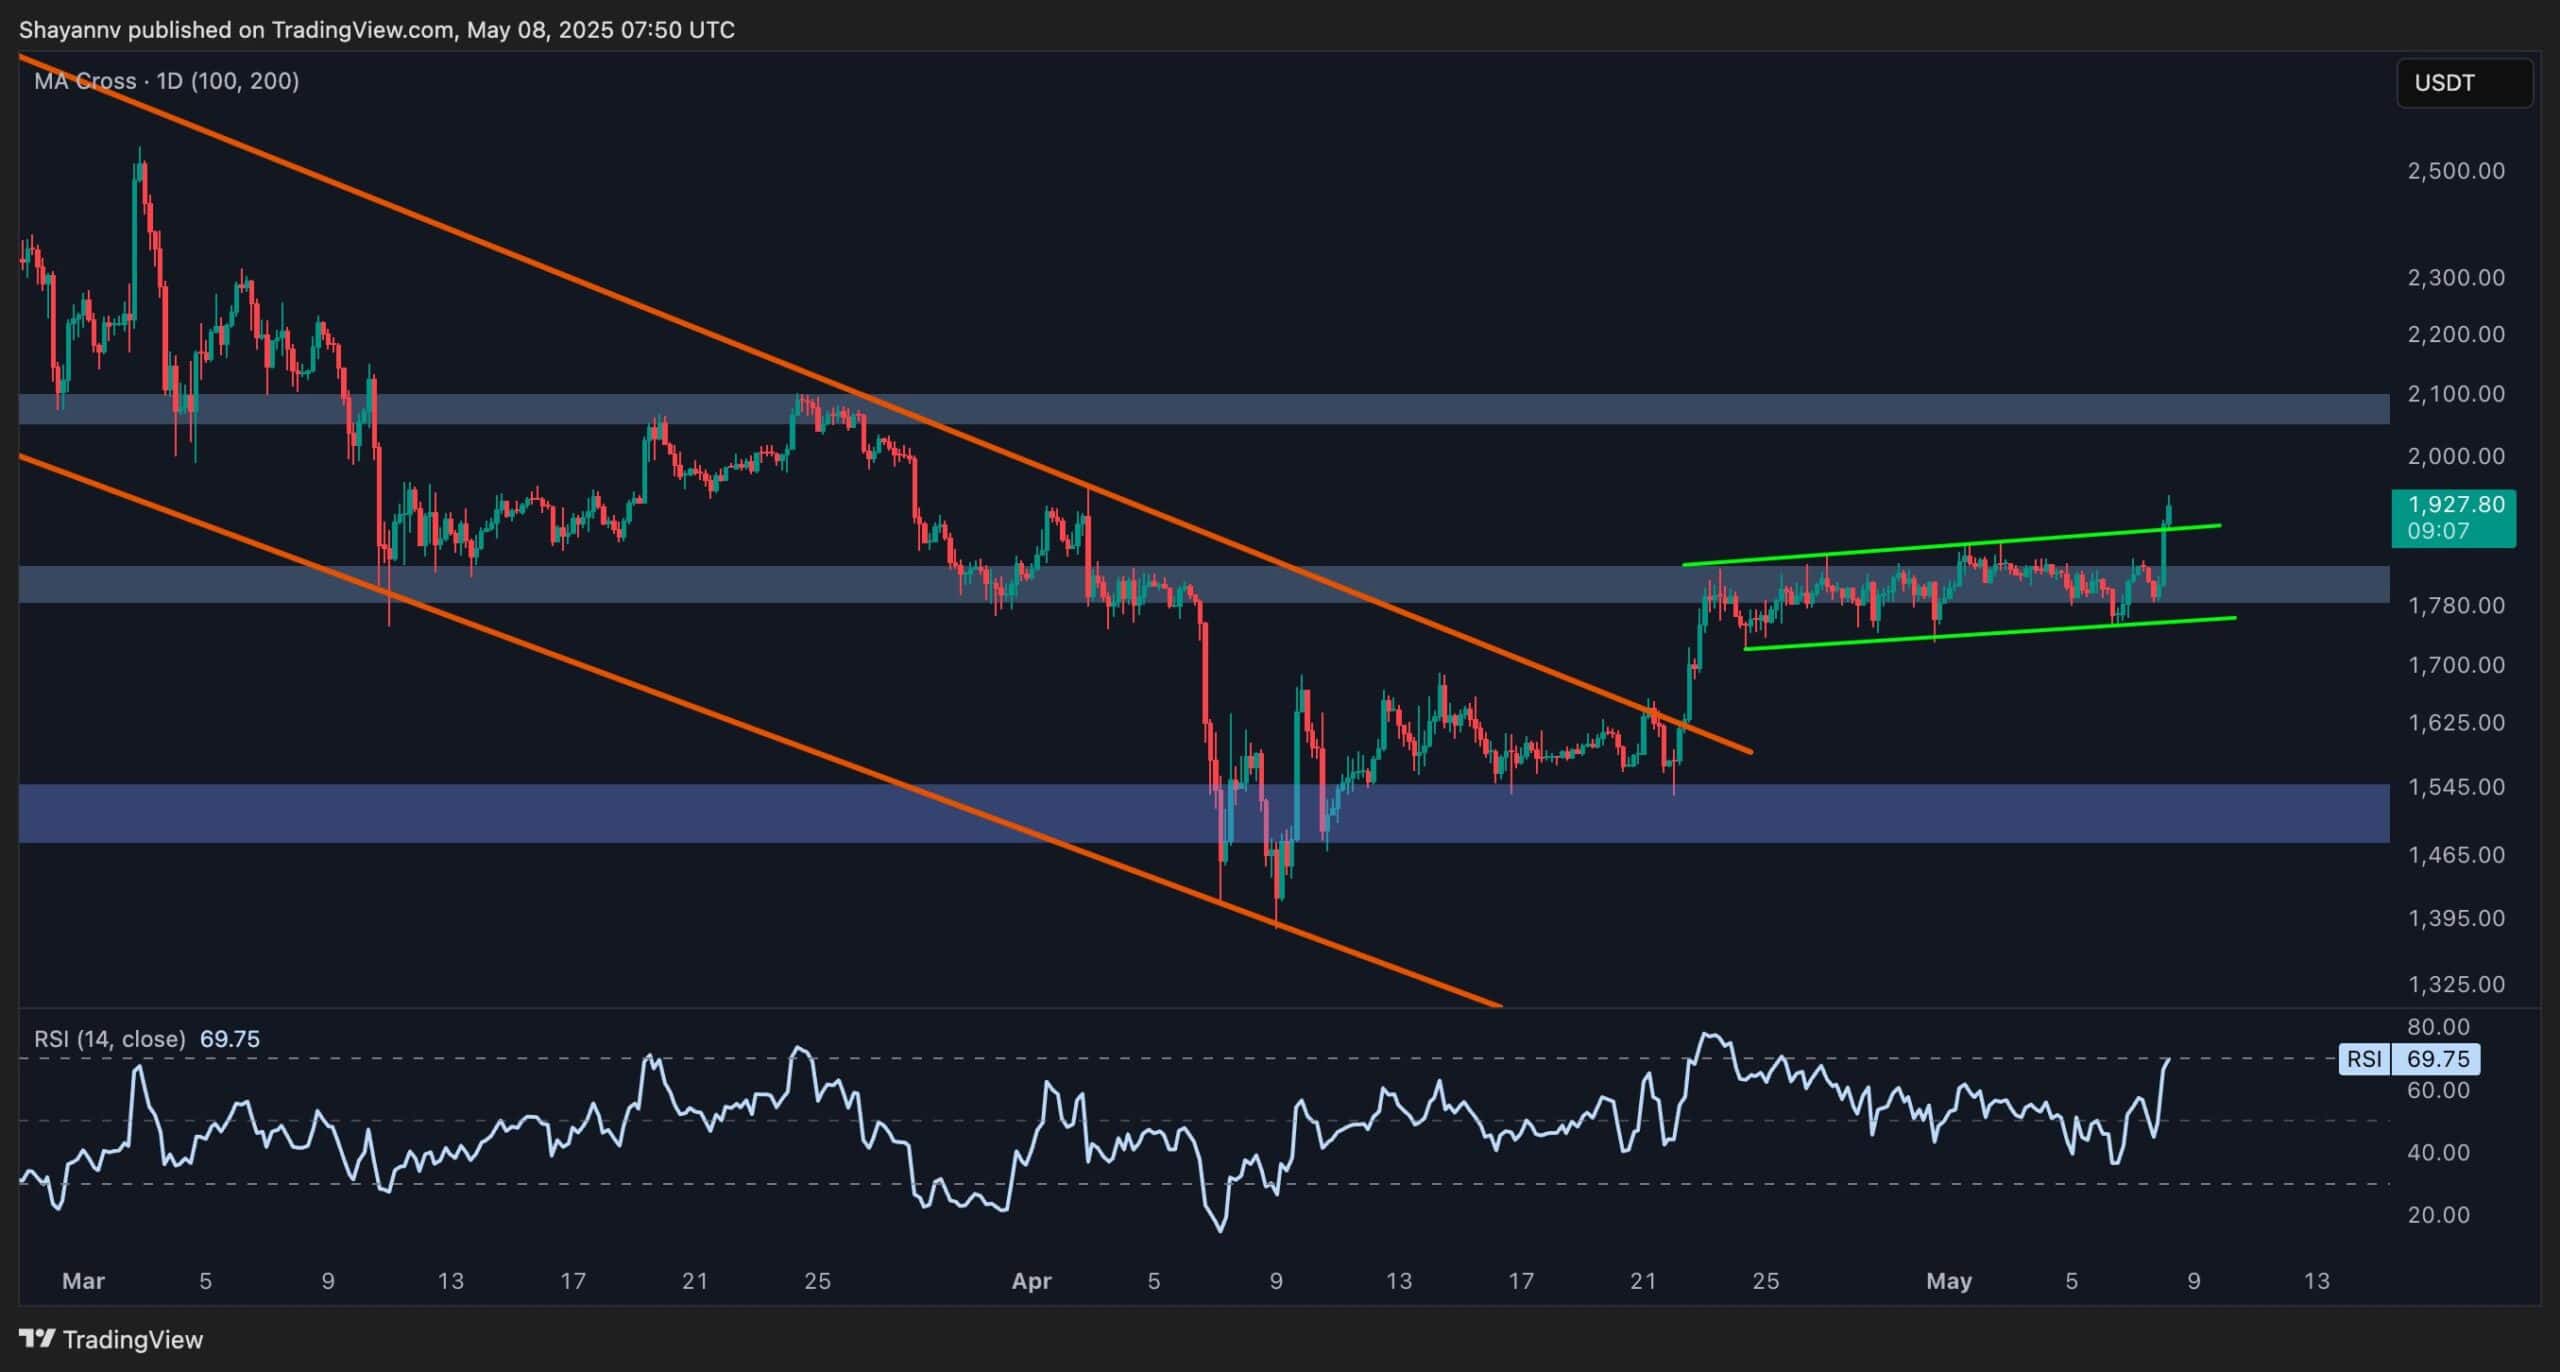
Sentiment Analysis
The Binance liquidation heatmap continues to provide valuable insights into Ethereum’s market structure and potential price trajectory. Following the recent uptrend, a significant cluster of liquidation levels was targeted just above the previous swing high near the critical $1.8K mark.
Historically, during periods of recovery or heightened bullish sentiment, markets often gravitate toward such liquidity pockets, as institutional players and smart money exploit trapped sellers by triggering forced liquidations.
At present, Ethereum’s price action reflects strengthening momentum, having rebounded decisively from the key $1.5K support and reclaimed several important technical levels. Meanwhile, the heatmap shows a lack of significant liquidity zones ahead, particularly in the path toward the $2.1K region. This absence of nearby sell-side liquidity suggests minimal resistance and supports the likelihood of a continued rally toward the $2.1K threshold.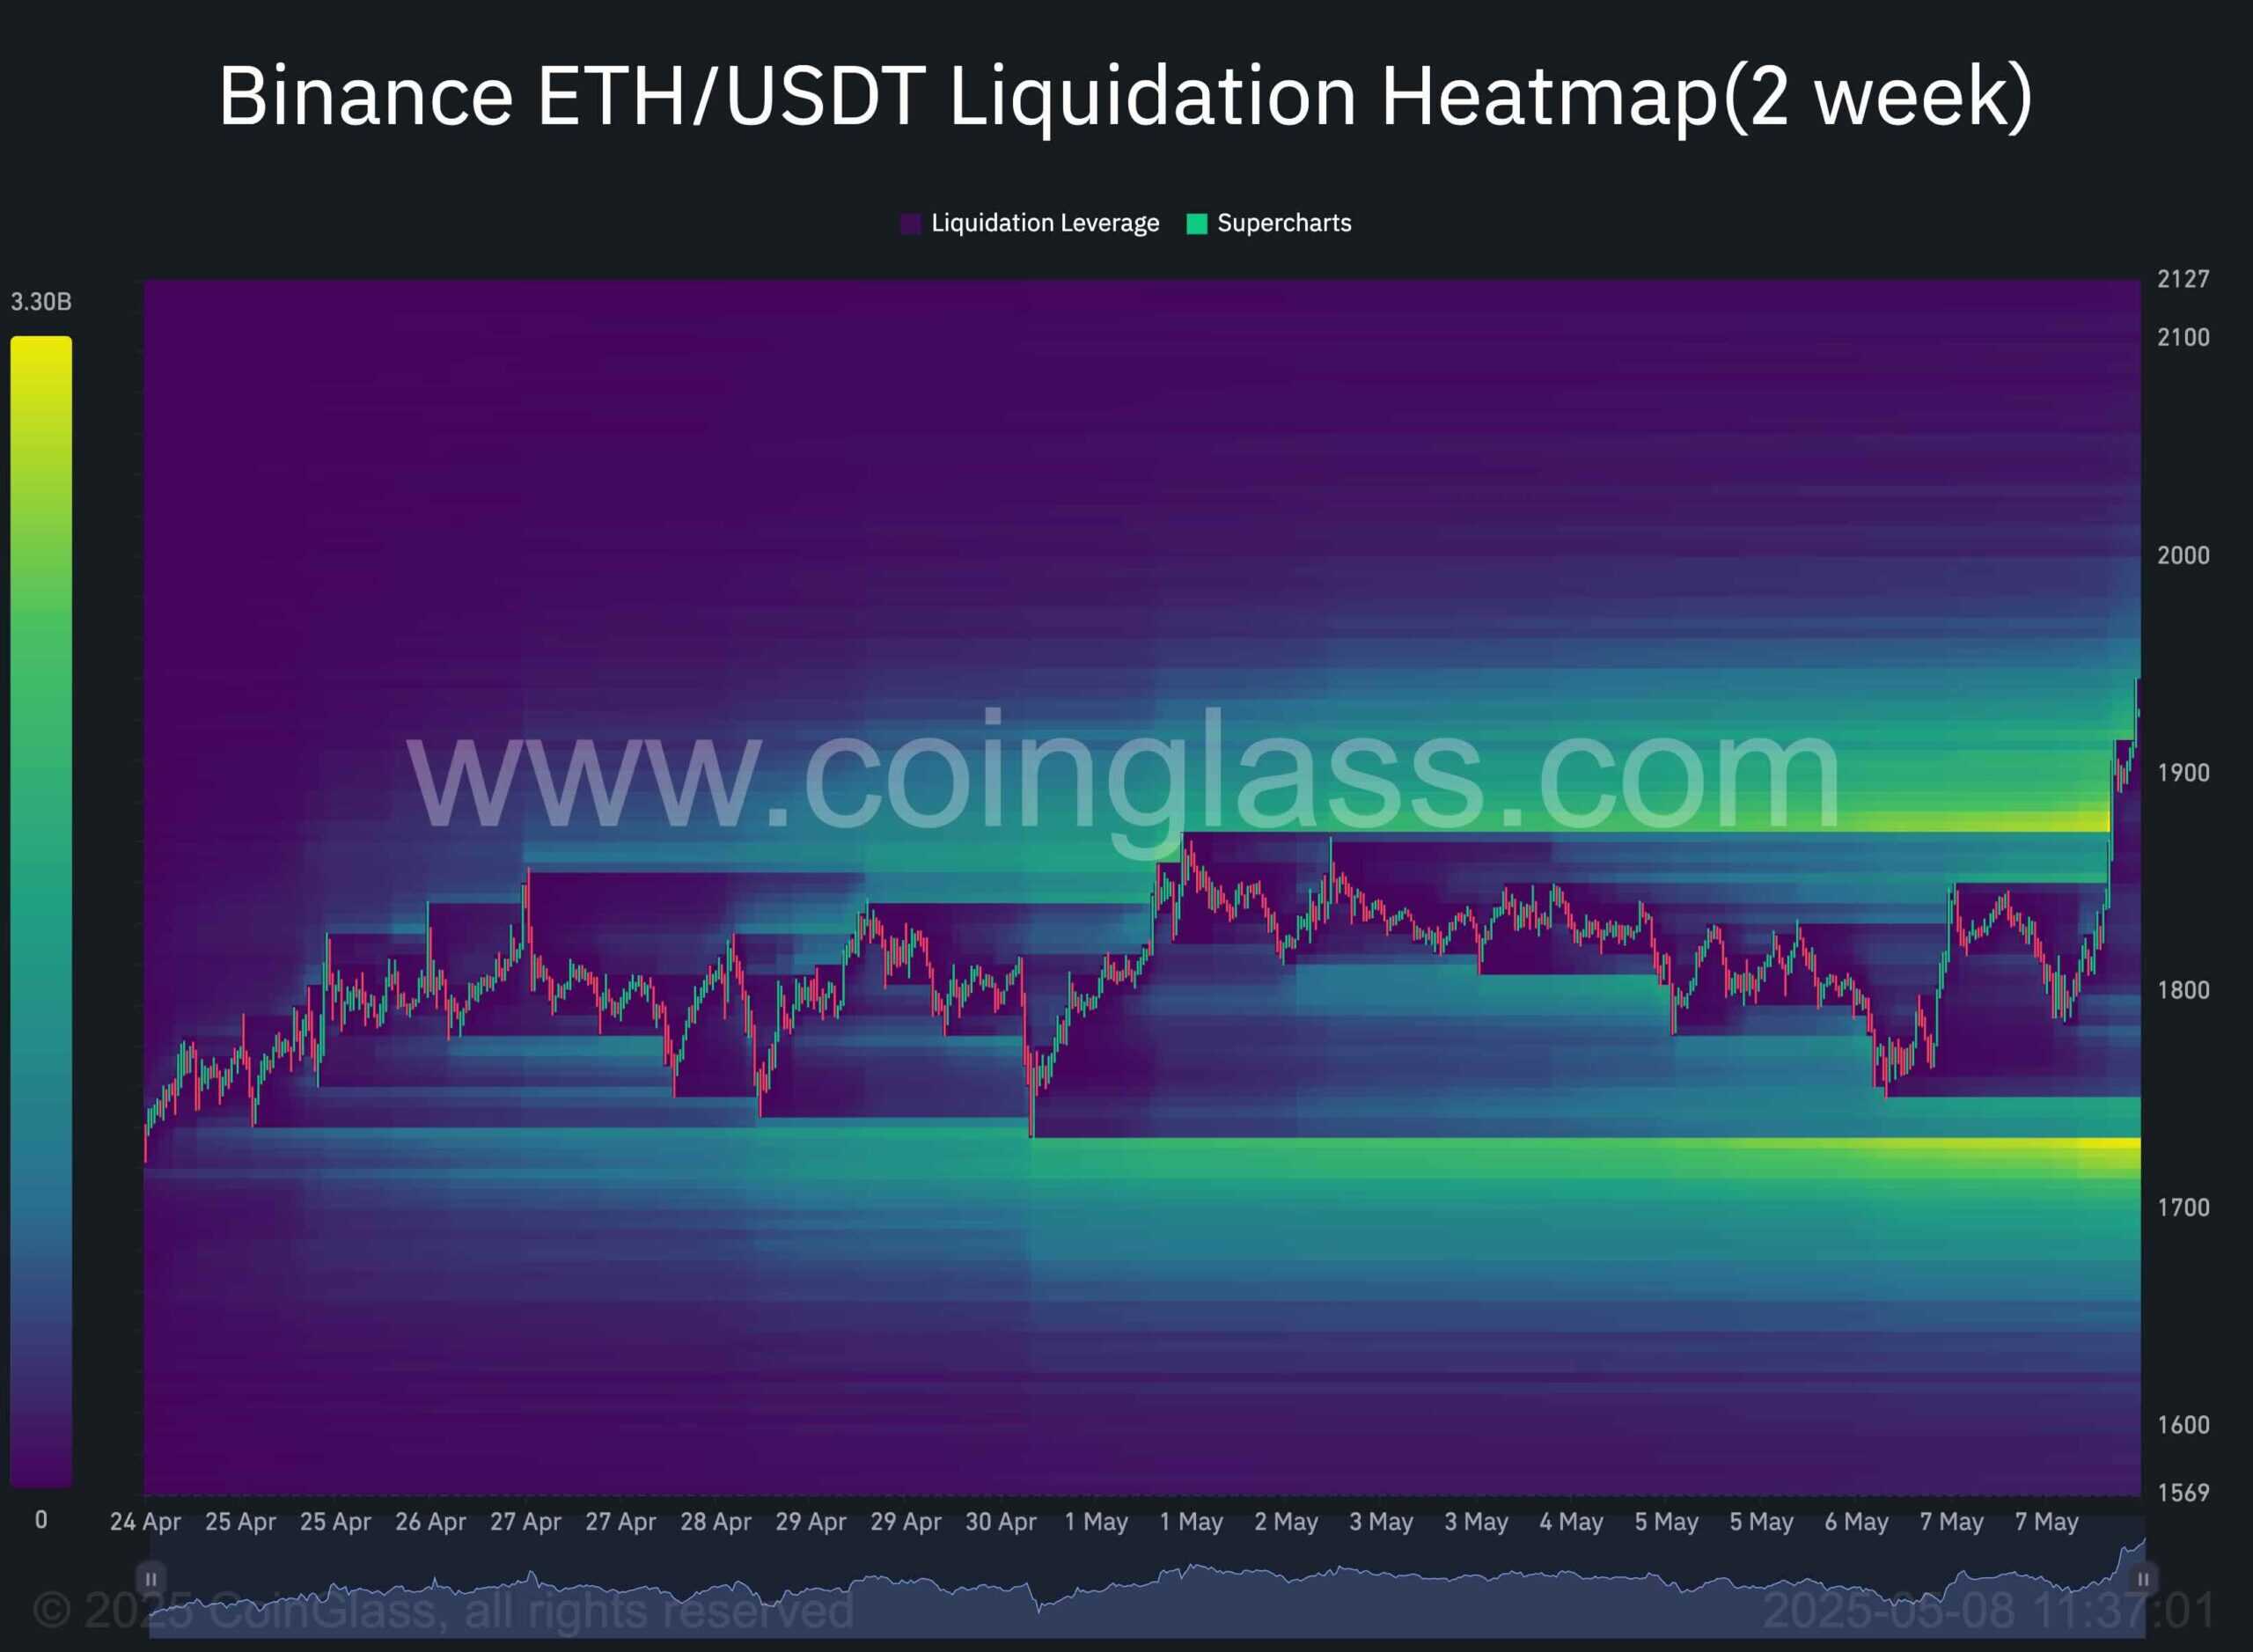
The post Ethereum Price Analysis: Next Targets Revealed as ETH Takes Down a Crucial Resistance appeared first on CryptoPotato.
Following a notable increase in demand, Ethereum surged past the $1.8K resistance level. The price is now expected to extend its bullish trend toward the significant $2.1K resistance region, which aligns with the 100-day moving average. Technical Analysis The Daily Chart A surge in buying activity near the critical $1.5K support level triggered a strong Crypto News, ETH Analysis, ETHBTC, ETHUSD, Ethereum (ETH) Price CryptoPotato