
Bitcoin bulls are trying to push higher from just under $97,000, attempting to confirm its latest breakout above a multi-day consolidation range. After stalling near $95,000 for over a week, Bitcoin broke out to $97,000 before reversing and forming a fair value gap.
This has led to a surge in activity on the Bitcoin blockchain, and the next outlook is whether the current structure holds for a continuation to $100,000 or if this momentum could falter at a zone of resistance.
Bitcoin Reaches 6-Month Peak In Network Activity
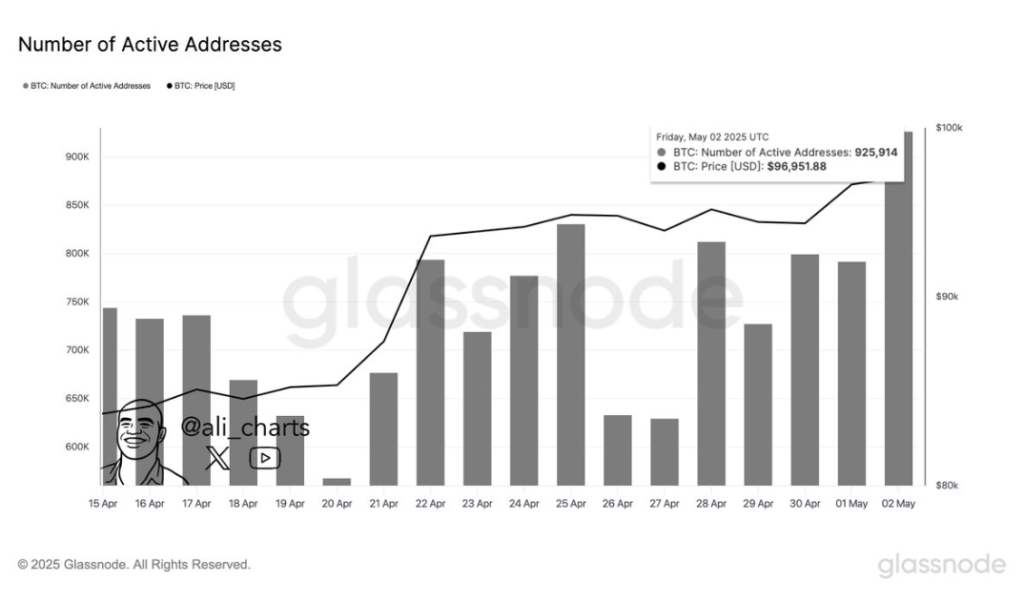
One of the most notable shifts in market dynamics came from the on-chain side. According to crypto analyst Ali Martinez, Bitcoin just recorded its highest number of active addresses in the past six months. As shared in a post on social media platform X, Martinez noted that 925,914 BTC addresses were active within a single day, which is an unusually high level of engagement on the Bitcoin blockchain.
The accompanying Glassnode chart reveals how steep this surge has been, building on a gradual climb that started in the last week of April. Interestingly, the spike in Bitcoin activity coincides with its recent reclaim of the $95,000 price range.
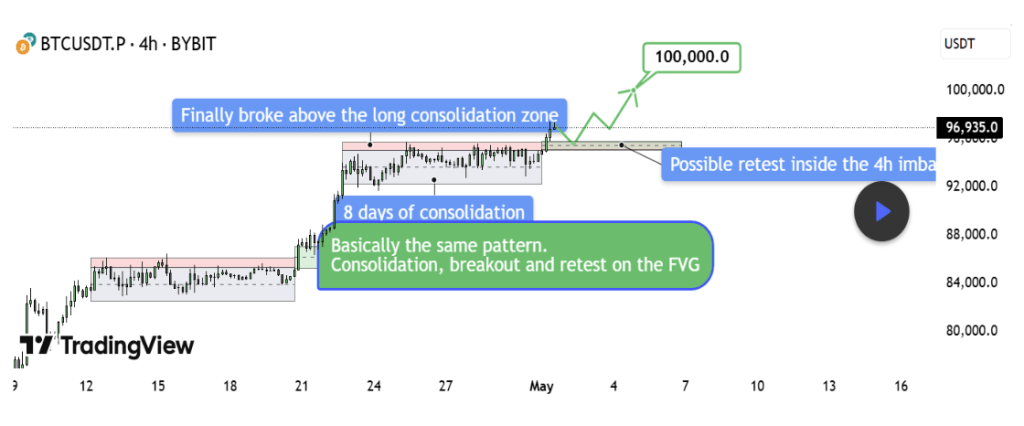
Adding to the bullish case, crypto analyst TehThomas shared a compelling technical analysis that pointed to a breakout continuation toward $100,000. Interpretation of the BTCUSDT 4-hour timeframe shows an almost identical structure to the one seen in mid-April.
Back then, Bitcoin consolidated near $86,000, broke out, left behind a fair value gap (FVG), retested the gap, and rallied nearly $10,000. A mirror image of this pattern is currently unfolding. The Bitcoin price compressed below $95,000, broke through resistance, and created a fresh FVG between $94,200 and $95,000.
TehThomas noted that the key is not to chase the breakout but to wait for a clean retest of the new FVG. If buyers defend that area as they did earlier this month, the road to $100,000 is structurally intact. However, even though the structure currently favors the bulls, the situation could turn bearish if Bitcoin drops back into the old range below $94,000.
Bearish Golden Pocket Setup Highlights Risk Ahead
Not all analysts are convinced that Bitcoin will reach $100,000 again without a shakeout first. A counterview on the TradingView platform highlights a possible short-term bearish setup based on the BTCUSDT 15-minute chart.
According to the analyst, the current upward retracement appears corrective rather than impulsive, forming a classic short setup within a strong fair value gap resistance zone. Technical analysis shows that Bitcoin has retraced into a region that aligns with a bearish fair value gap and the golden pocket zone defined by the 0.618 to 0.65 Fibonacci levels.
As it stands, the fair value gap is sitting between $97,000 and $97,450. Should price fail to break through this supply region, it could reverse and catch bulls off guard.
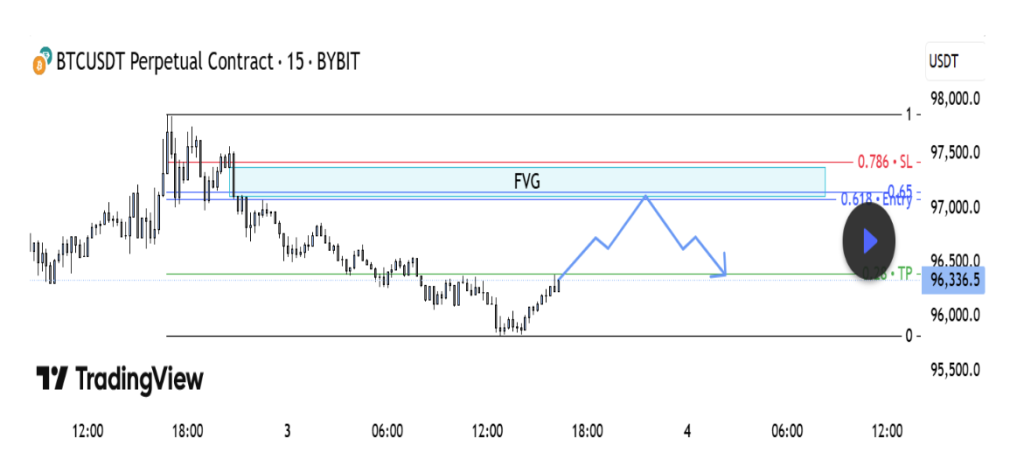
Chart from TradingView
At the time of writing, Bitcoin was trading at $96,040.
Featured image from Unsplash, chart from TradingView
Bitcoin bulls are trying to push higher from just under $97,000, attempting to confirm its latest breakout above a multi-day consolidation range. After stalling near $95,000 for over a week, Bitcoin broke out to $97,000 before reversing and forming a fair value gap. Related Reading: Bitcoin To Infinity? Venture Capitalist Says Crypto’s Value Vs. Dollar Has No Ceiling This has led to a surge in activity on the Bitcoin blockchain, and the next outlook is whether the current structure holds for a continuation to $100,000 or if this momentum could falter at a zone of resistance. Bitcoin Reaches 6-Month Peak In Network Activity One of the most notable shifts in market dynamics came from the on-chain side. According to crypto analyst Ali Martinez, Bitcoin just recorded its highest number of active addresses in the past six months. As shared in a post on social media platform X, Martinez noted that 925,914 BTC addresses were active within a single day, which is an unusually high level of engagement on the Bitcoin blockchain. The accompanying Glassnode chart reveals how steep this surge has been, building on a gradual climb that started in the last week of April. Interestingly, the spike in Bitcoin activity coincides with its recent reclaim of the $95,000 price range. Image From X: @ali_charts Adding to the bullish case, crypto analyst TehThomas shared a compelling technical analysis that pointed to a breakout continuation toward $100,000. Interpretation of the BTCUSDT 4-hour timeframe shows an almost identical structure to the one seen in mid-April. Back then, Bitcoin consolidated near $86,000, broke out, left behind a fair value gap (FVG), retested the gap, and rallied nearly $10,000. A mirror image of this pattern is currently unfolding. The Bitcoin price compressed below $95,000, broke through resistance, and created a fresh FVG between $94,200 and $95,000. TehThomas noted that the key is not to chase the breakout but to wait for a clean retest of the new FVG. If buyers defend that area as they did earlier this month, the road to $100,000 is structurally intact. However, even though the structure currently favors the bulls, the situation could turn bearish if Bitcoin drops back into the old range below $94,000. Chart from TradingView Bearish Golden Pocket Setup Highlights Risk Ahead Not all analysts are convinced that Bitcoin will reach $100,000 again without a shakeout first. A counterview on the TradingView platform highlights a possible short-term bearish setup based on the BTCUSDT 15-minute chart. According to the analyst, the current upward retracement appears corrective rather than impulsive, forming a classic short setup within a strong fair value gap resistance zone. Technical analysis shows that Bitcoin has retraced into a region that aligns with a bearish fair value gap and the golden pocket zone defined by the 0.618 to 0.65 Fibonacci levels. Related Reading: Bitcoin At $100K? $3 Billion In Shorts Are On The Line As it stands, the fair value gap is sitting between $97,000 and $97,450. Should price fail to break through this supply region, it could reverse and catch bulls off guard. Chart from TradingView At the time of writing, Bitcoin was trading at $96,040. Featured image from Unsplash, chart from TradingView Bitcoin, bitcoin, Bitcoin news, bitcoin price, blockchain, btcusd, cryptocurrency NewsBTC