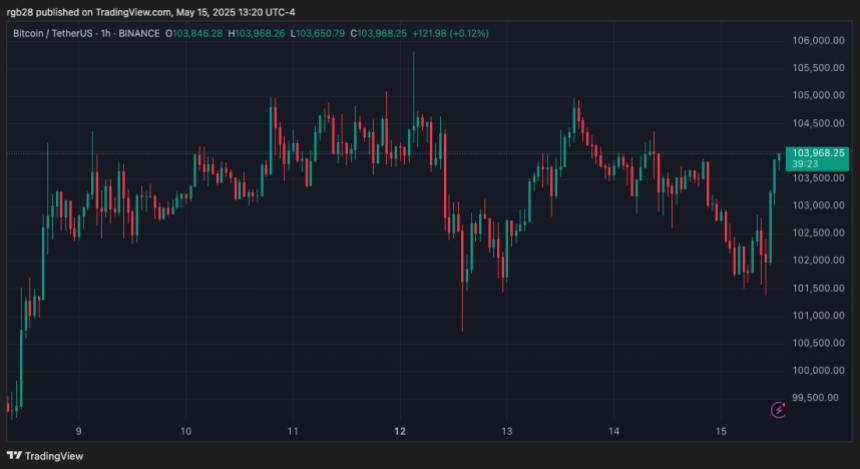
After reclaiming the crucial $100,000, Bitcoin (BTC) is testing its recently recovered levels as support, with some analysts suggesting that the price will see a short-term sideways move before breaking out of its key resistance.
BTC’s Next Key Levels
Over the past month, Bitcoin has seen a massive performance, recovering more than 23% from the $84,000 mark. The flagship crypto has reclaimed the $100,000 barrier, lost during the February pullback, and rallied to a three-month high of $105,819.
Amid the market recovery, BTC has re-entered its post-US elections range, between the $92,000 and $106,000 levels, trading just 4.4% below its January all-time high (ATH). However, the massive rally seems to have slowed after nearing the range’s upper level, which could momentarily halt its next leg up.
This week, Bitcoin has ranged between $101,500-$105,000, taking out most of the liquidation clusters within the weekly range lows. Daan Crypto Trades pointed out that now the cryptocurrency is “pretty far away from any large liquidity clusters.”
He explained that BTC’s price hasn’t traded in the range’s high for a significant period, and few new positions were built around this area “after the initial squeeze of shorts.”
As such, the main levels to look out for are the range’s highs above the $106,000 resistance, and the range’s low around the $93,000 support, where the recent breakout occurred.
Bitcoin To Trade Sideways For Two Weeks?
Analyst The Cryptonomist considers that BTC’s price action is “very simple from here,” as the flagship crypto moves within a one-month rising wedge pattern. If Bitcoin remains inside the formation, it could surge to the $110,000-$112,000 levels.
However, if Bitcoin falls below the lower boundary, around $100,000, it could lose the key support and attempt to fill the CME Gap around the $92,000 before a new ATH rally.
Meanwhile, market watcher Ted Pillows highlighted Bitcoin’s correlation with the Global M2 money supply. The analyst noted that the cryptocurrency’s price action has resembled the Global M2 supply chart for the past several months, including the recent pump above $100,000.
Now the chart suggests a consolidation period, which could see Bitcoin move sideways for one to two weeks, if it continues to follow the Global M2 supply path. “Once that is over, BTC’s next leg up will start, which will push it above $120K,” he affirmed.
Additionally, Ted pointed out BTC’s Wyckoff accumulation is in the final phase, with some consolidation happening above the $100,000 support, “which is a good sign.” Concluding that, with liquidity entering again, the next leg up “will soon start.”
As of this writing, Bitcoin trades at $104,916, a 0.5% decline in the daily timeframe.

After reclaiming the crucial $100,000, Bitcoin (BTC) is testing its recently recovered levels as support, with some analysts suggesting that the price will see a short-term sideways move before breaking out of its key resistance. Related Reading: Avalanche (AVAX) Eyes 30% Rally Amid Cup-And-Handle Pattern Breakout BTC’s Next Key Levels Over the past month, Bitcoin has seen a massive performance, recovering more than 23% from the $84,000 mark. The flagship crypto has reclaimed the $100,000 barrier, lost during the February pullback, and rallied to a three-month high of $105,819. Amid the market recovery, BTC has re-entered its post-US elections range, between the $92,000 and $106,000 levels, trading just 4.4% below its January all-time high (ATH). However, the massive rally seems to have slowed after nearing the range’s upper level, which could momentarily halt its next leg up. This week, Bitcoin has ranged between $101,500-$105,000, taking out most of the liquidation clusters within the weekly range lows. Daan Crypto Trades pointed out that now the cryptocurrency is “pretty far away from any large liquidity clusters.” He explained that BTC’s price hasn’t traded in the range’s high for a significant period, and few new positions were built around this area “after the initial squeeze of shorts.” As such, the main levels to look out for are the range’s highs above the $106,000 resistance, and the range’s low around the $93,000 support, where the recent breakout occurred. Bitcoin To Trade Sideways For Two Weeks? Analyst The Cryptonomist considers that BTC’s price action is “very simple from here,” as the flagship crypto moves within a one-month rising wedge pattern. If Bitcoin remains inside the formation, it could surge to the $110,000-$112,000 levels. However, if Bitcoin falls below the lower boundary, around $100,000, it could lose the key support and attempt to fill the CME Gap around the $92,000 before a new ATH rally. Meanwhile, market watcher Ted Pillows highlighted Bitcoin’s correlation with the Global M2 money supply. The analyst noted that the cryptocurrency’s price action has resembled the Global M2 supply chart for the past several months, including the recent pump above $100,000. Related Reading: Ethereum Prepares For $2,850 Rally, But Analysts Warn Of Potential Dip To These Levels Now the chart suggests a consolidation period, which could see Bitcoin move sideways for one to two weeks, if it continues to follow the Global M2 supply path. “Once that is over, BTC’s next leg up will start, which will push it above $120K,” he affirmed. Additionally, Ted pointed out BTC’s Wyckoff accumulation is in the final phase, with some consolidation happening above the $100,000 support, “which is a good sign.” Concluding that, with liquidity entering again, the next leg up “will soon start.” As of this writing, Bitcoin trades at $104,916, a 0.5% decline in the daily timeframe. Featured Image from Unsplash.com, Chart from TradingView.com Bitcoin, bitcoin, Bitcoin ATH, bitcoin breakout, btc, btc analysis, btc price, BTCUSDT, crypto analyst, Crypto Bull Run 2025, crypto market orrection, Crypto Market Recovery, Crypto trader NewsBTC


