Bitcoin recently tapped into the $111K zone, sweeping buy-side liquidity before showing signs of rejection. As the market pauses after a strong rally, technical and on-chain indicators suggest a potential pullback or consolidation phase, with traders now eyeing key levels for the next move.
Technical Analysis
By ShayanMarkets
The Daily Chart
BTC experienced a notable rejection from the $111K supply zone after capturing the buy-side liquidity above the January-February highs. This move triggered an immediate drop and initiated a correction, with current price action showing signs of potential continuation lower.
The daily RSI has also cooled off and is now hovering around the neutral 50 zone, indicating a pause in momentum. The 100 and 200-day moving averages remain bullishly aligned below price (located in the $90K-$95K range), and there is a visible fair value gap (FVG) between $101K and $98K, which may act as a magnet for price in the short term, but can also act as a demand zone to push the asset higher after penetration.
Yet, despite the rejection from the $111K level, the overall structure remains bullish with price still holding above the ascending trendline and moving averages. As long as the asset remains above the $91K demand zone, the buyers are still in control structurally. If the FVG gets filled and the reaction is strong, it could create a new higher low and set the stage for another attempt toward the $111K–$114K resistance zone.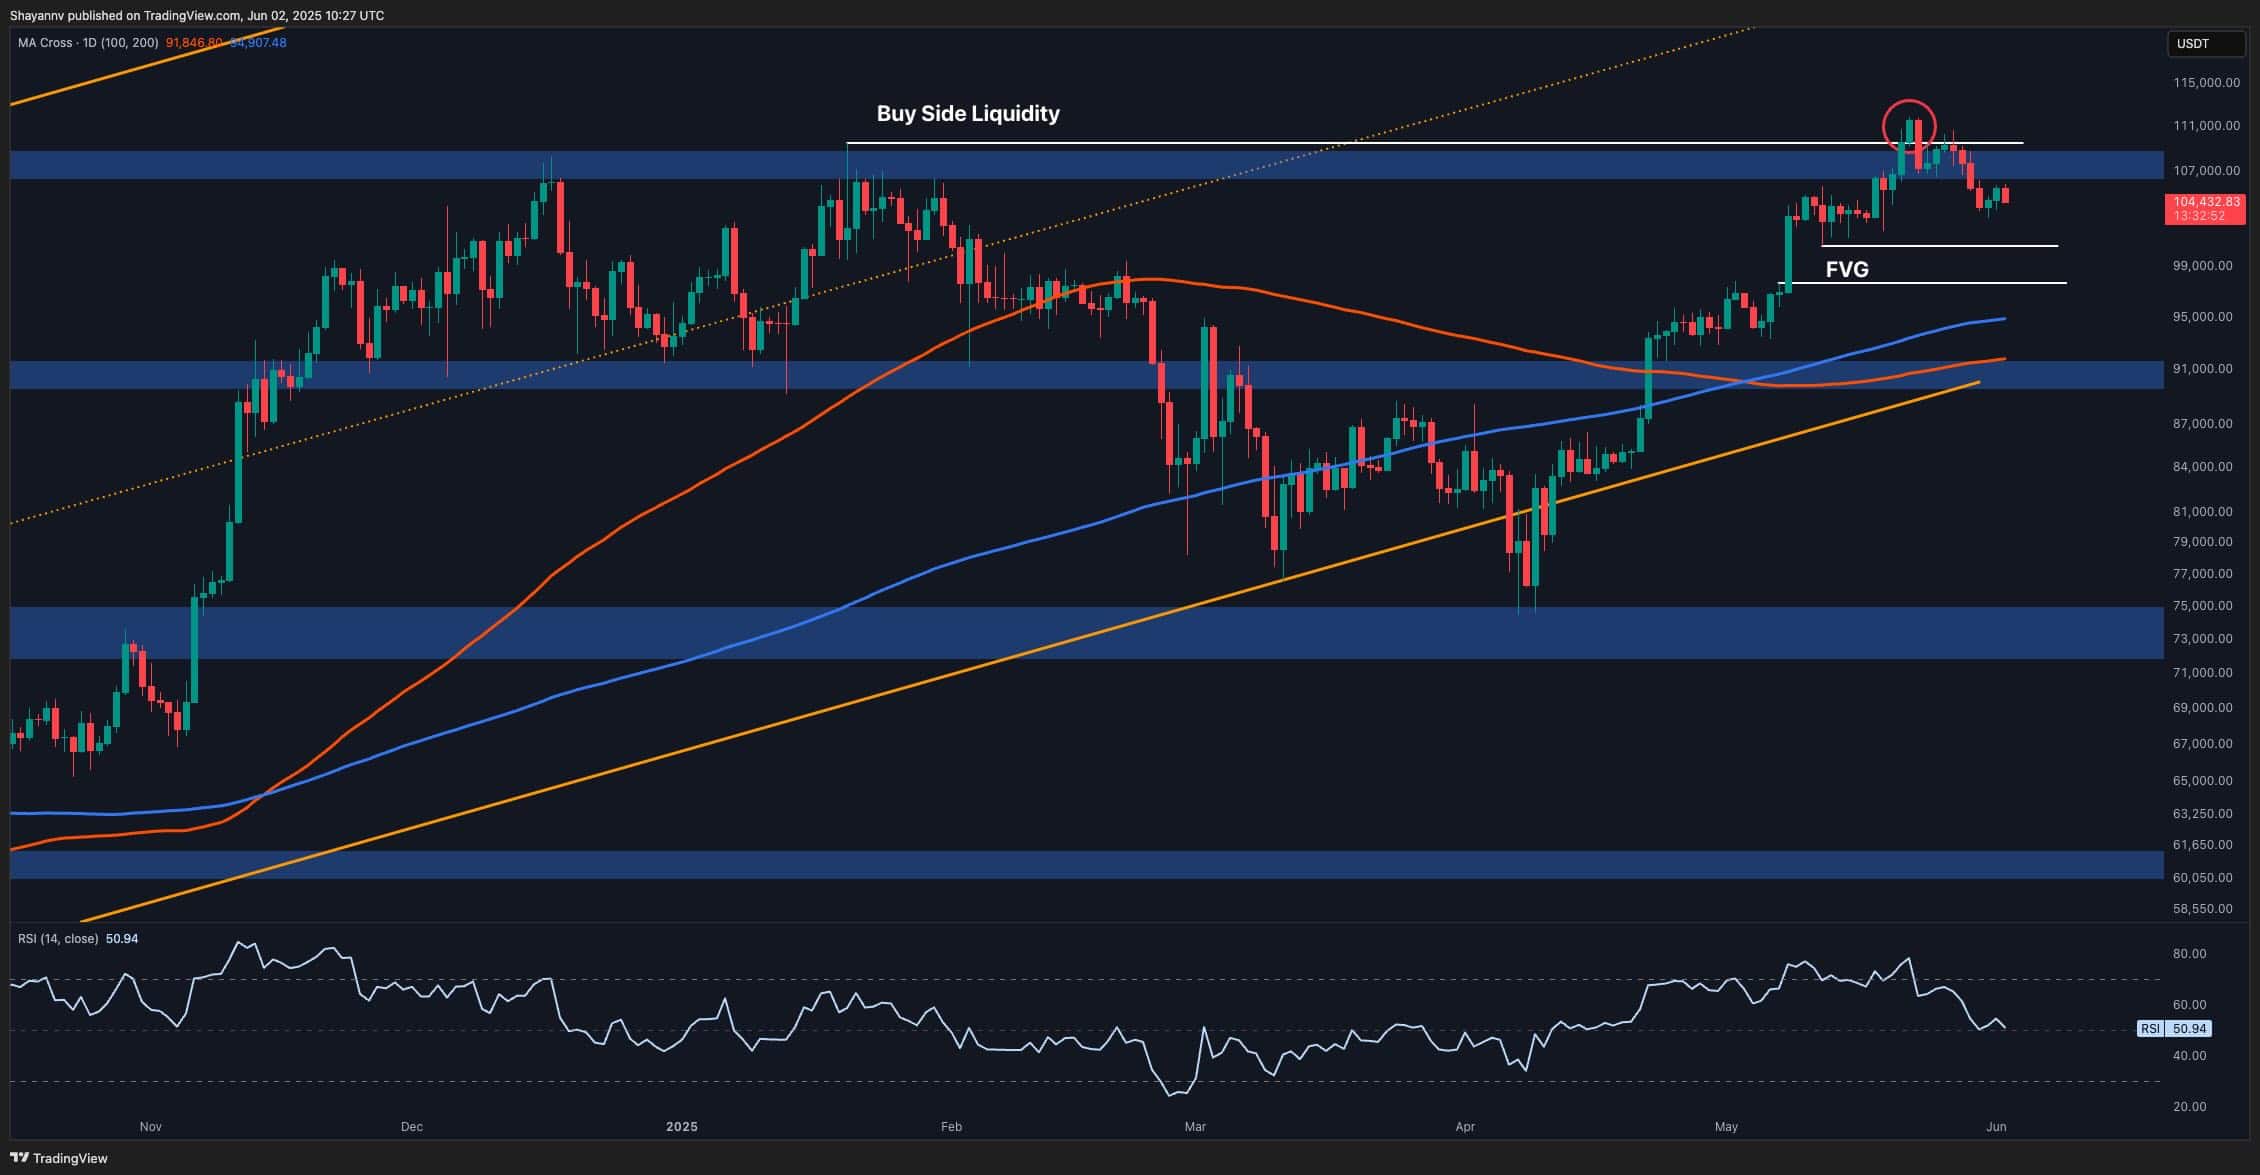
The 4-Hour Chart
Zooming into the 4H chart, BTC has broken below the ascending channel that had guided price action since early April. The breakdown was followed by a rejection from the $108K zone, suggesting that previous support has now turned into resistance.
Moreover, the RSI on this timeframe is slightly below 50, pointing to bearish momentum gaining ground. There is also a clear range forming between $102K and $108K, with the price oscillating within it after the initial sell-off.
Short-term traders should pay close attention to the mid-range and the recent swing lows near $102K. A break below this level could trigger a sharper move toward the $100K support level.
On the flip side, reclaiming the $108K mark could invalidate the short-term bearish setup and open the doors for a retest of the range high and possibly $111K again. However, as things stand, the market is likely to go through a deeper correction in the coming days.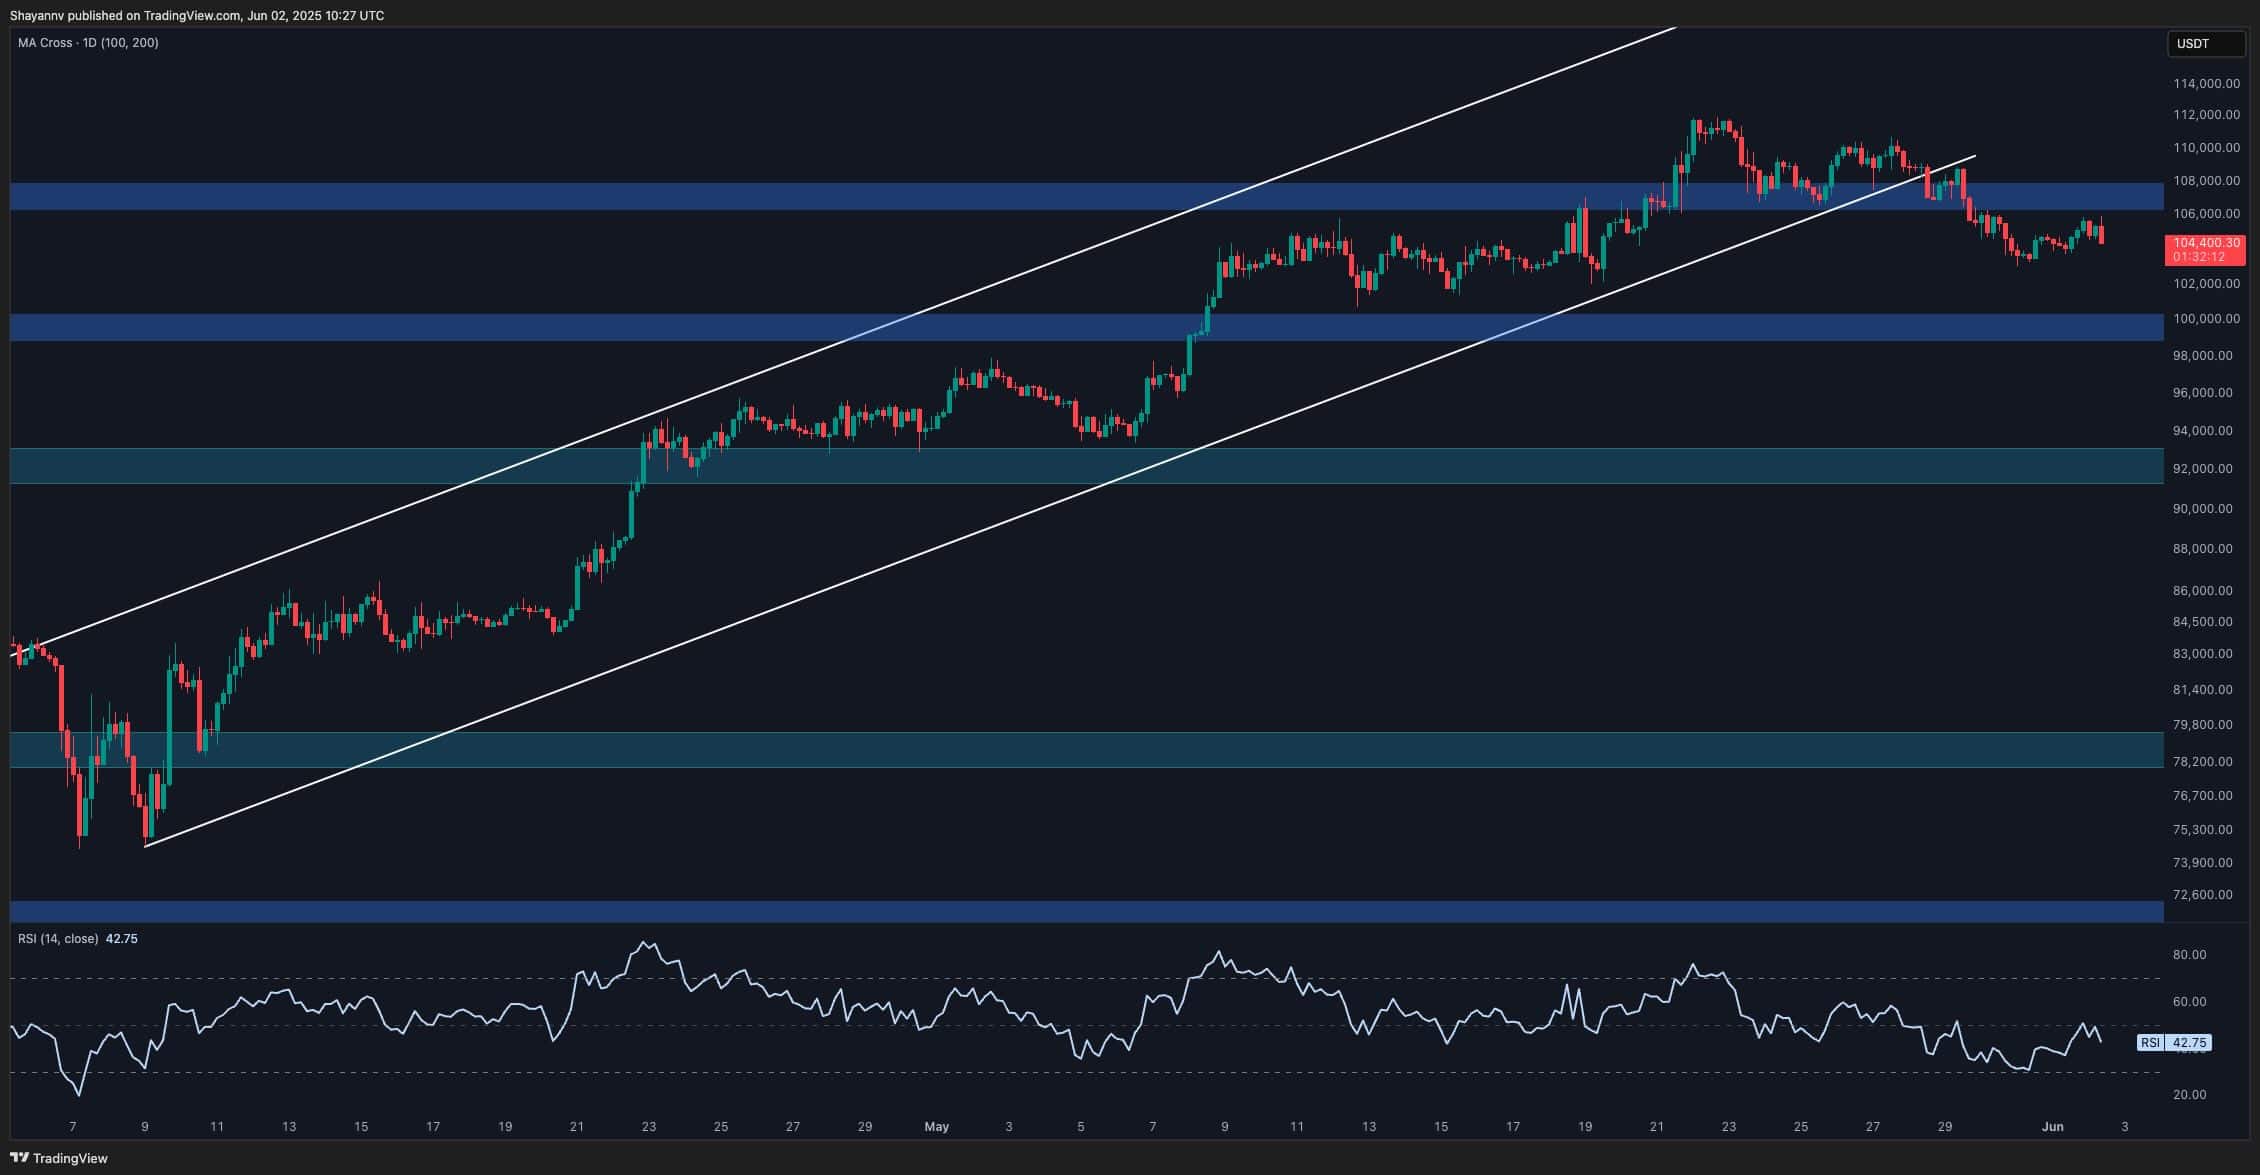
On-Chain Analysis
Adjusted SOPR (30-day EMA)
The 30-day exponential moving average of Bitcoin’s Adjusted SOPR (aSOPR) has been on the rise well above the 1.0 threshold, indicating that, on average, coins moving on-chain are doing so in profit.
This generally reflects renewed investor confidence, as holders become more willing to sell at a profit rather than capitulate at a loss. Historically, sustained aSOPR values above 1.0 during uptrends support bullish continuation, especially when price corrections are shallow.
However, the current reading also suggests the market is entering a more sensitive phase. When the aSOPR rises too aggressively, it often precedes local tops as short-term holders rush to realize profits. A healthy trend would see a slight aSOPR reset above 1.0, ideally aligning with a price pullback into a support zone, before the next leg up.
The post Bitcoin Price Analysis: BTC in Danger of Prolonged Correction After Recent Rejection appeared first on CryptoPotato.
Bitcoin recently tapped into the $111K zone, sweeping buy-side liquidity before showing signs of rejection. As the market pauses after a strong rally, technical and on-chain indicators suggest a potential pullback or consolidation phase, with traders now eyeing key levels for the next move. Technical Analysis By ShayanMarkets The Daily Chart BTC experienced a notable BTC Analysis, BTCEUR, BTCGBP, BTCUSD, BTCUSDT, Crypto News, Bitcoin (BTC) Price CryptoPotato