
Bitcoin price started a fresh surge above the $102,500 zone. BTC is now correcting gains and trading below the $103,500 resistance zone.
- Bitcoin started a strong increase above the $102,500 resistance zone.
- The price is trading below $104,000 and the 100 hourly Simple moving average.
- There was a break below a new connecting bullish trend line with support at $103,900 on the hourly chart of the BTC/USD pair (data feed from Kraken).
- The pair could start another increase if it clears the $103,500 zone.
Bitcoin Price Corrects Some Gains
Bitcoin price started a fresh increase from the $98,500 support zone. BTC formed a base and was able to clear the $100,000 resistance zone. The bulls even pushed the price above $103,000.
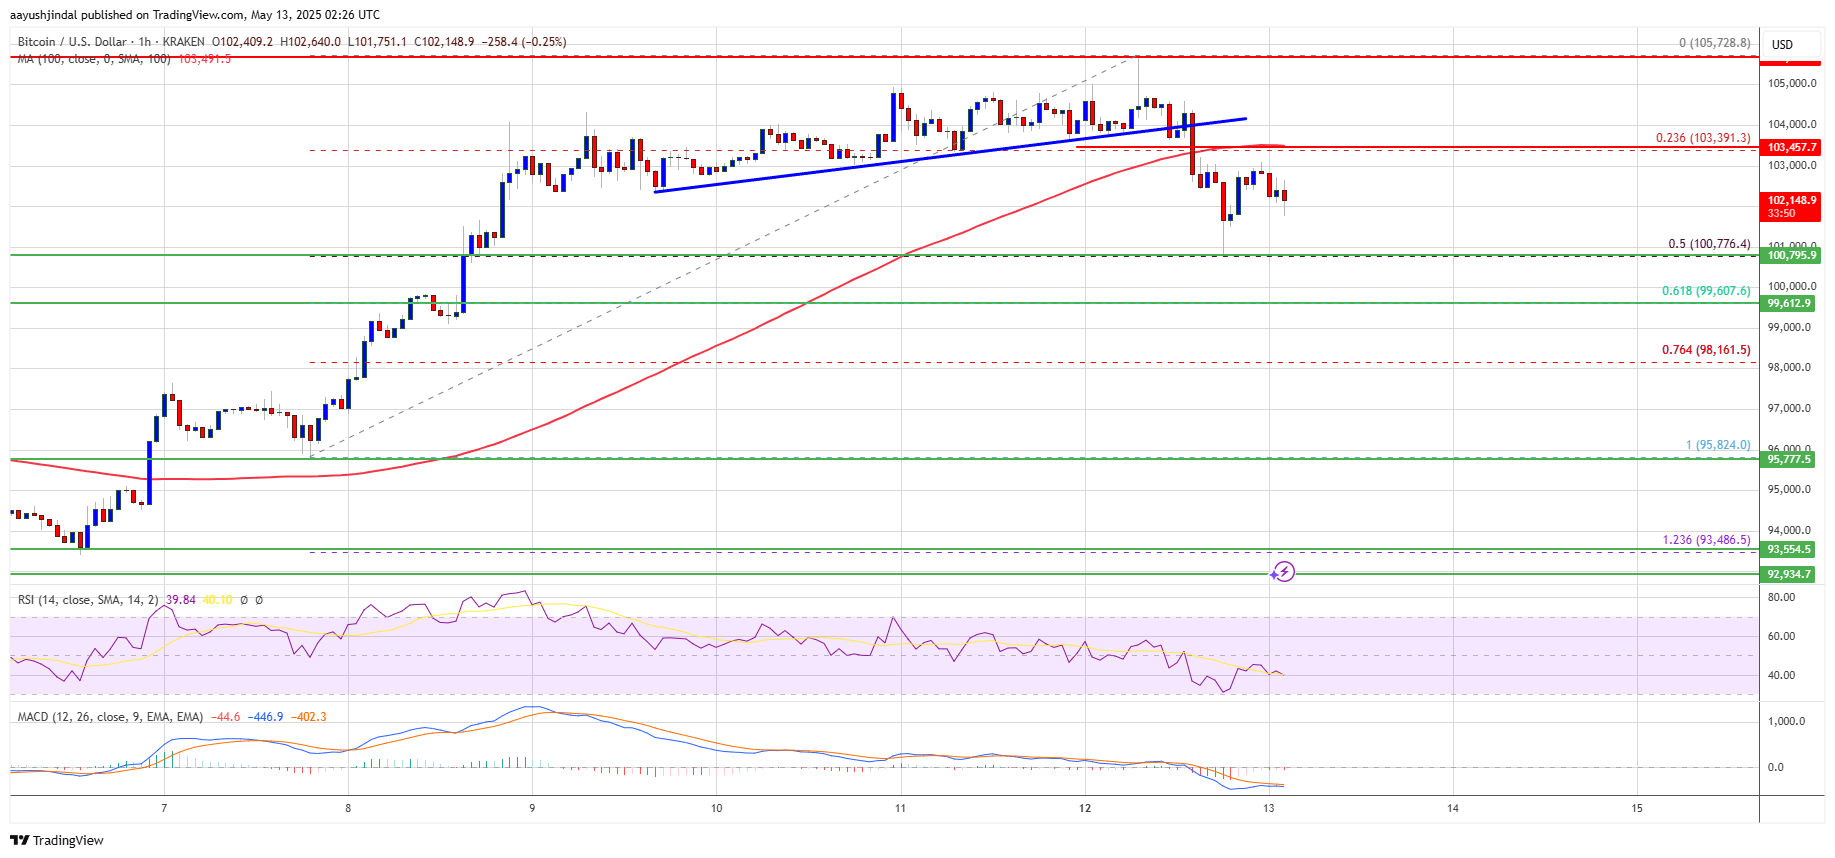
The pair spiked above $105,500 and tested $105,800. A high is formed at $105,728 and the price is now correcting gains. There was a move below the 23.6% Fib retracement level of the upward move from the $95,825 swing low to the $105,728 high.
There was break below a new connecting bullish trend line with support at $103,900 on the hourly chart of the BTC/USD pair. Bitcoin is now trading below $104,500 and the 100 hourly Simple moving average.
However, the bulls are now active near the $100,800 support and protecting the 50% Fib retracement level of the upward move from the $95,825 swing low to the $105,728 high. On the upside, immediate resistance is near the $103,500 level. The first key resistance is near the $104,000 level.
The next key resistance could be $105,000. A close above the $105,000 resistance might send the price further higher. In the stated case, the price could rise and test the $106,000 resistance level. Any more gains might send the price toward the $108,000 level.
More Losses In BTC?
If Bitcoin fails to rise above the $103,500 resistance zone, it could start another downside correction. Immediate support on the downside is near the $101,500 level. The first major support is near the $100,800 level.
The next support is now near the $100,000 zone. Any more losses might send the price toward the $98,800 support in the near term. The main support sits at $97,500.
Technical indicators:
Hourly MACD – The MACD is now losing pace in the bullish zone.
Hourly RSI (Relative Strength Index) – The RSI for BTC/USD is now below the 50 level.
Major Support Levels – $101,500, followed by $100,800.
Major Resistance Levels – $103,500 and $105,000.
Bitcoin price started a fresh surge above the $102,500 zone. BTC is now correcting gains and trading below the $103,500 resistance zone. Bitcoin started a strong increase above the $102,500 resistance zone. The price is trading below $104,000 and the 100 hourly Simple moving average. There was a break below a new connecting bullish trend line with support at $103,900 on the hourly chart of the BTC/USD pair (data feed from Kraken). The pair could start another increase if it clears the $103,500 zone. Bitcoin Price Corrects Some Gains Bitcoin price started a fresh increase from the $98,500 support zone. BTC formed a base and was able to clear the $100,000 resistance zone. The bulls even pushed the price above $103,000. The pair spiked above $105,500 and tested $105,800. A high is formed at $105,728 and the price is now correcting gains. There was a move below the 23.6% Fib retracement level of the upward move from the $95,825 swing low to the $105,728 high. There was break below a new connecting bullish trend line with support at $103,900 on the hourly chart of the BTC/USD pair. Bitcoin is now trading below $104,500 and the 100 hourly Simple moving average. However, the bulls are now active near the $100,800 support and protecting the 50% Fib retracement level of the upward move from the $95,825 swing low to the $105,728 high. On the upside, immediate resistance is near the $103,500 level. The first key resistance is near the $104,000 level. The next key resistance could be $105,000. A close above the $105,000 resistance might send the price further higher. In the stated case, the price could rise and test the $106,000 resistance level. Any more gains might send the price toward the $108,000 level. More Losses In BTC? If Bitcoin fails to rise above the $103,500 resistance zone, it could start another downside correction. Immediate support on the downside is near the $101,500 level. The first major support is near the $100,800 level. The next support is now near the $100,000 zone. Any more losses might send the price toward the $98,800 support in the near term. The main support sits at $97,500. Technical indicators: Hourly MACD – The MACD is now losing pace in the bullish zone. Hourly RSI (Relative Strength Index) – The RSI for BTC/USD is now below the 50 level. Major Support Levels – $101,500, followed by $100,800. Major Resistance Levels – $103,500 and $105,000. BTC, bitcoin, bitcoin price, btcusd, BTCUSDT, xbtusd NewsBTC