Chainlink (LINK) is currently consolidating around the $15 level, as bulls attempt to reclaim higher ground after a volatile yet promising few weeks. Despite facing stiff resistance near this zone, LINK continues to show strength amid a broader market rebound, holding steady while many other altcoins experience mixed performance.
The asset is now up over 50% from its April lows, suggesting that bullish momentum is building beneath the surface. Market participants are closely watching for signs of a breakout, especially as the overall crypto market heats up and investors rotate capital back into high-potential altcoins.
Adding to the optimism, top analyst Ali Martínez shared a technical chart indicating that the SuperTrend indicator has just flashed a buy signal on Chainlink’s daily chart. This indicator is often viewed as a reliable tool for identifying the start of new bullish phases or trend reversals. A confirmation of this signal could set the stage for further gains if bulls manage to clear the current resistance.
As the market awaits clarity, LINK’s ability to hold its current level and potentially break higher may set the tone for its next significant move, possibly reigniting a long-awaited rally for the popular oracle protocol.
Chainlink Eyes Breakout as Momentum Builds
Chainlink has been range-bound between $10 and $16 since March, consolidating after a volatile start to the year. Despite the sideways action, market participants are increasingly focused on the potential for a breakout as LINK presses against its key resistance level around $16. A sustained move above this barrier could trigger a strong upside move, especially if accompanied by a broader altcoin rally.
The current setup comes amid high-risk macroeconomic conditions. Global tensions continue to rise, particularly between the US and China, where escalating tariffs and trade disputes have sparked fears of a global recession. Such a backdrop adds a layer of caution to any bullish outlook, as risk assets remain vulnerable to sudden shifts in investor sentiment.
Nevertheless, optimism for Chainlink has grown after Ali Martínez pointed out that the SuperTrend indicator has flashed a buy signal on LINK’s daily chart. This technical tool is often used to detect early trend reversals or sustained shifts in market direction. When it appears after a prolonged consolidation, as it has now, it can signal that bullish momentum is about to accelerate.
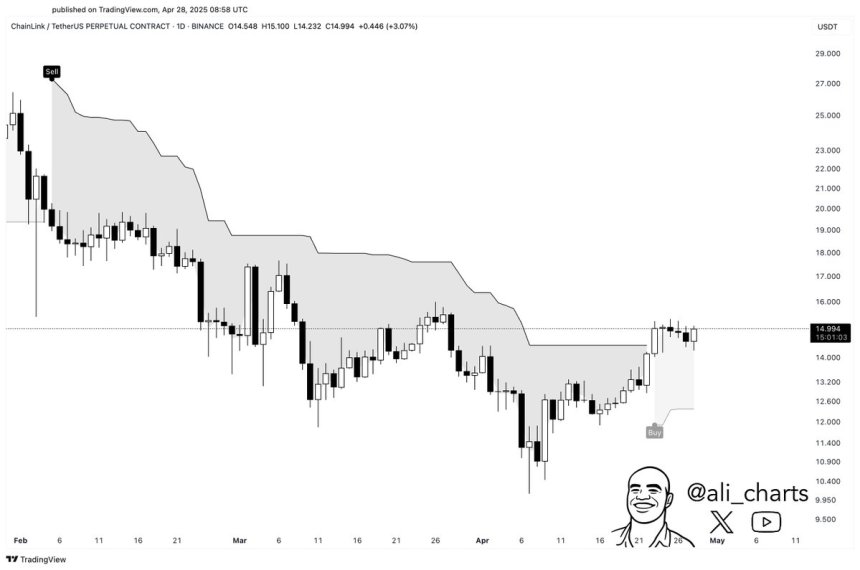
If bulls manage to reclaim and hold levels above $16, it could confirm a trend change and potentially send LINK surging toward new 2024 highs. Still, until the price breakouts, the range remains in play—and so does the risk of another rejection.
LINK Price Analysis: Key Levels
Chainlink is currently trading at $15.10, gradually climbing toward the critical $16 resistance level. This zone has acted as a ceiling throughout April and May, and bulls now face a pivotal test. Reclaiming and holding above $16 would not only break the multi-week range but also set the stage for a possible breakout if momentum continues to build.
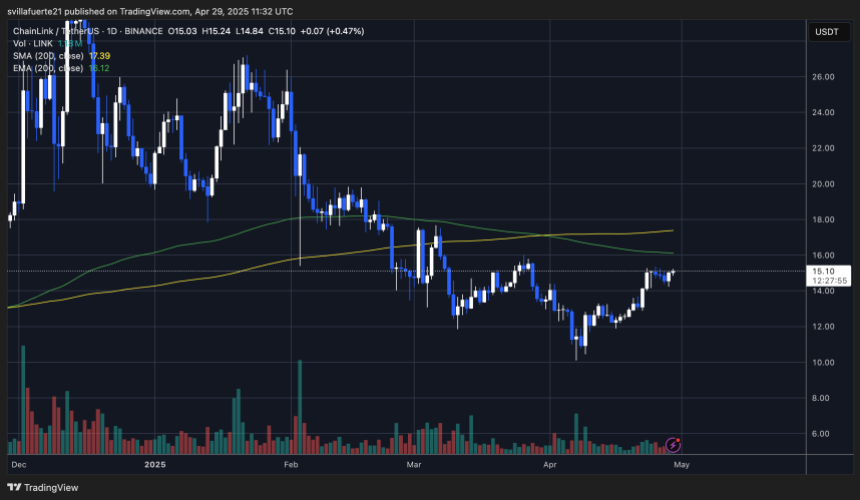
The technical picture highlights the importance of the 200-day moving average (MA) and exponential moving average (EMA), both clustered in the $16–$17 range. These trend indicators have served as dynamic resistance in recent months, and a clean push above them could confirm a bullish reversal and open the path toward higher targets.
However, the structure remains fragile, and failure to maintain strength could put LINK at risk of a deeper pullback. If the $14 support level breaks, selling pressure may accelerate, potentially dragging the price toward lower demand zones around $12 or even $10.
As the broader market heats up and speculative appetite returns, LINK’s positioning around this key resistance will likely determine its short-term trend. A decisive move in either direction could shape the price action heading into the next few weeks.
Featured image from Dall-E, chart from TradingView
Chainlink (LINK) is currently consolidating around the $15 level, as bulls attempt to reclaim higher ground after a volatile yet promising few weeks. Despite facing stiff resistance near this zone, LINK continues to show strength amid a broader market rebound, holding steady while many other altcoins experience mixed performance. Related Reading: Ethereum Shows 4H Bearish Divergence – Can Bulls Hold $1,750? The asset is now up over 50% from its April lows, suggesting that bullish momentum is building beneath the surface. Market participants are closely watching for signs of a breakout, especially as the overall crypto market heats up and investors rotate capital back into high-potential altcoins. Adding to the optimism, top analyst Ali Martínez shared a technical chart indicating that the SuperTrend indicator has just flashed a buy signal on Chainlink’s daily chart. This indicator is often viewed as a reliable tool for identifying the start of new bullish phases or trend reversals. A confirmation of this signal could set the stage for further gains if bulls manage to clear the current resistance. As the market awaits clarity, LINK’s ability to hold its current level and potentially break higher may set the tone for its next significant move, possibly reigniting a long-awaited rally for the popular oracle protocol. Chainlink Eyes Breakout as Momentum Builds Chainlink has been range-bound between $10 and $16 since March, consolidating after a volatile start to the year. Despite the sideways action, market participants are increasingly focused on the potential for a breakout as LINK presses against its key resistance level around $16. A sustained move above this barrier could trigger a strong upside move, especially if accompanied by a broader altcoin rally. The current setup comes amid high-risk macroeconomic conditions. Global tensions continue to rise, particularly between the US and China, where escalating tariffs and trade disputes have sparked fears of a global recession. Such a backdrop adds a layer of caution to any bullish outlook, as risk assets remain vulnerable to sudden shifts in investor sentiment. Nevertheless, optimism for Chainlink has grown after Ali Martínez pointed out that the SuperTrend indicator has flashed a buy signal on LINK’s daily chart. This technical tool is often used to detect early trend reversals or sustained shifts in market direction. When it appears after a prolonged consolidation, as it has now, it can signal that bullish momentum is about to accelerate. If bulls manage to reclaim and hold levels above $16, it could confirm a trend change and potentially send LINK surging toward new 2024 highs. Still, until the price breakouts, the range remains in play—and so does the risk of another rejection. Related Reading: Solana Forms Textbook Cup And Handle Pattern – Massive Breakout Ahead? LINK Price Analysis: Key Levels Chainlink is currently trading at $15.10, gradually climbing toward the critical $16 resistance level. This zone has acted as a ceiling throughout April and May, and bulls now face a pivotal test. Reclaiming and holding above $16 would not only break the multi-week range but also set the stage for a possible breakout if momentum continues to build. The technical picture highlights the importance of the 200-day moving average (MA) and exponential moving average (EMA), both clustered in the $16–$17 range. These trend indicators have served as dynamic resistance in recent months, and a clean push above them could confirm a bullish reversal and open the path toward higher targets. However, the structure remains fragile, and failure to maintain strength could put LINK at risk of a deeper pullback. If the $14 support level breaks, selling pressure may accelerate, potentially dragging the price toward lower demand zones around $12 or even $10. Related Reading: Ethereum Reclaims Local Range Against BTC – Can Bulls Target The Range High? As the broader market heats up and speculative appetite returns, LINK’s positioning around this key resistance will likely determine its short-term trend. A decisive move in either direction could shape the price action heading into the next few weeks. Featured image from Dall-E, chart from TradingView Chainlink News, chainlink, Chainlink analysis, Chainlink Bullish, Chainlink buy signal, Chainlink news, Chainlink price, Chainlink Price Analysis, Link, linkusdt NewsBTC