According to a fresh analysis by a crypto analyst, the Ethereum price has broken out of a months-long downtrend, reigniting bullish sentiment across the market. With volume rising and key resistance levels expected to turn into support, Ethereum is set to complete its bullish structure, aiming for a potential break toward $3,000.
Ethereum Price Targets $3,000 Breakout
The Ethereum price action on the 4-hour chart has reportedly flipped bullish, following a sharp breakout above a long-standing descending trendline that capped its movements since late 2024. As a result, a pseudonymous TradingView crypto analyst identified as ‘Orihadad66’ has predicted that Ethereum could soon see a surge to $3,000.
The analyst explains that Ethereum’s recent shift from bearish to bullish wasn’t a subtle move, as a high-volume candle had pierced through both the trendline and the $2,100 – $2,150 resistance zone, confirming a clearer shift in market structure. This breakout is significant, as it marks the first time Ethereum has invalidated the broader bearish pattern that dominated the early part of 2025.
The $2,100 – $2,150 area now acts as a potential support zone for its price, and a successful retest would solidify it as a launchpad for further upside. Orihadad66 has confirmed that the immediate bullish target for Ethereum lies between the $2,500 – $2,550 price range. Historically, this region has been a key liquidity zone where previous price rejections frequently occurred. This makes the zone a potential profit-taking area as ETH consolidates post-breakout.
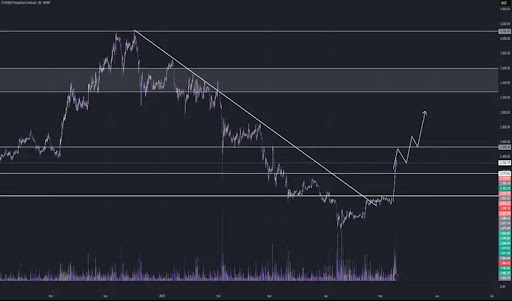
Technical projections suggest that Ethereum may briefly pull back toward the $2,350 – $2,400 range to form a potential higher low. If this pullback holds, bulls could drive the next leg up toward $2,800 – $3,000 — a confluence zone that includes both a supply barrier and psychological resistance.
Furthermore, the TradingView analyst has predicted that a clean break above $3,000 could open the door to the $3,300 – $3,600 supply block, potentially triggering a larger bullish trend reversal. With Ethereum currently trading at $2,544, a surge to $3,000 or even $3,600 would represent a 17.9% and 41.5% increase, respectively.
Bullish Thesis At Risk Below $2,100
While the analysis published by Orihadad66 has highlighted Ethereum’s almost completed bullish structure and potential breakout target, the setup also comes with a clear invalidation level. The TradingView analyst has warned that a 4-hour candle close below the $2,100 support zone or a breakdown beneath the reclaimed descending trendline would signal weakness, potentially nullifying the bullish thesis.
Such a move would suggest that the recent breakout was a false one, possibly a liquidity grab that could open the door to increased selling pressure. The analyst has suggested that traders should monitor price action around the $2,100 level. Until this invalidation point is reached, the analyst’s projected breakout, retest, and continuation scenario remains the dominant roadmap.
According to a fresh analysis by a crypto analyst, the Ethereum price has broken out of a months-long downtrend, reigniting bullish sentiment across the market. With volume rising and key resistance levels expected to turn into support, Ethereum is set to complete its bullish structure, aiming for a potential break toward $3,000. Ethereum Price Targets $3,000 Breakout The Ethereum price action on the 4-hour chart has reportedly flipped bullish, following a sharp breakout above a long-standing descending trendline that capped its movements since late 2024. As a result, a pseudonymous TradingView crypto analyst identified as ‘Orihadad66’ has predicted that Ethereum could soon see a surge to $3,000. Related Reading: Ethereum Surge Above $2,200 Says Bear Market Is Over, Analyst Calls $5,791 ‘Easy’ Target The analyst explains that Ethereum’s recent shift from bearish to bullish wasn’t a subtle move, as a high-volume candle had pierced through both the trendline and the $2,100 – $2,150 resistance zone, confirming a clearer shift in market structure. This breakout is significant, as it marks the first time Ethereum has invalidated the broader bearish pattern that dominated the early part of 2025. The $2,100 – $2,150 area now acts as a potential support zone for its price, and a successful retest would solidify it as a launchpad for further upside. Orihadad66 has confirmed that the immediate bullish target for Ethereum lies between the $2,500 – $2,550 price range. Historically, this region has been a key liquidity zone where previous price rejections frequently occurred. This makes the zone a potential profit-taking area as ETH consolidates post-breakout. Technical projections suggest that Ethereum may briefly pull back toward the $2,350 – $2,400 range to form a potential higher low. If this pullback holds, bulls could drive the next leg up toward $2,800 – $3,000 — a confluence zone that includes both a supply barrier and psychological resistance. Furthermore, the TradingView analyst has predicted that a clean break above $3,000 could open the door to the $3,300 – $3,600 supply block, potentially triggering a larger bullish trend reversal. With Ethereum currently trading at $2,544, a surge to $3,000 or even $3,600 would represent a 17.9% and 41.5% increase, respectively. Bullish Thesis At Risk Below $2,100 While the analysis published by Orihadad66 has highlighted Ethereum’s almost completed bullish structure and potential breakout target, the setup also comes with a clear invalidation level. The TradingView analyst has warned that a 4-hour candle close below the $2,100 support zone or a breakdown beneath the reclaimed descending trendline would signal weakness, potentially nullifying the bullish thesis. Related Reading: Ethereum Macro Trend Oscillator Shows Green Might Be On The Horizon Such a move would suggest that the recent breakout was a false one, possibly a liquidity grab that could open the door to increased selling pressure. The analyst has suggested that traders should monitor price action around the $2,100 level. Until this invalidation point is reached, the analyst’s projected breakout, retest, and continuation scenario remains the dominant roadmap. Featured image from Pixabay, chart from Tradingview.com Ethereum, Bullish Structure, Descending Trendline, ETH, ETH news, eth price, ethereum, ethereum news, ethereum price, ethusd, ETHUSDT, Orihadad66 NewsBTC