Veteran wave technician “BigMike7335” (@Michael_EWpro) argues that the XRP token has just completed a textbook reversal on the daily chart. In a post that accompanied the chart shown below, the strategist quipped, “While you were busy being all excited about COIN being added to ES, XRP decided to breakout.”
XRP Breakout Confirmed
The annotated Bitstamp daily shows price clawing back to $2.5717, a 21% gain over the last seven sessions that decisively lifts the token through a six-month neckline sitting fractionally above $2.40. That horizontal barrier—coloured red on the chart—coincides with the top of a thin, downward-slanted Ichimoku cloud. Thursday’s close placed the candle not only above the Kumo but also above the 50-day EMA (orange), the 100-day EMA (aqua) and the 200-day SMA (dark blue), stacking the moving-average ribbon in a classic bullish configuration.
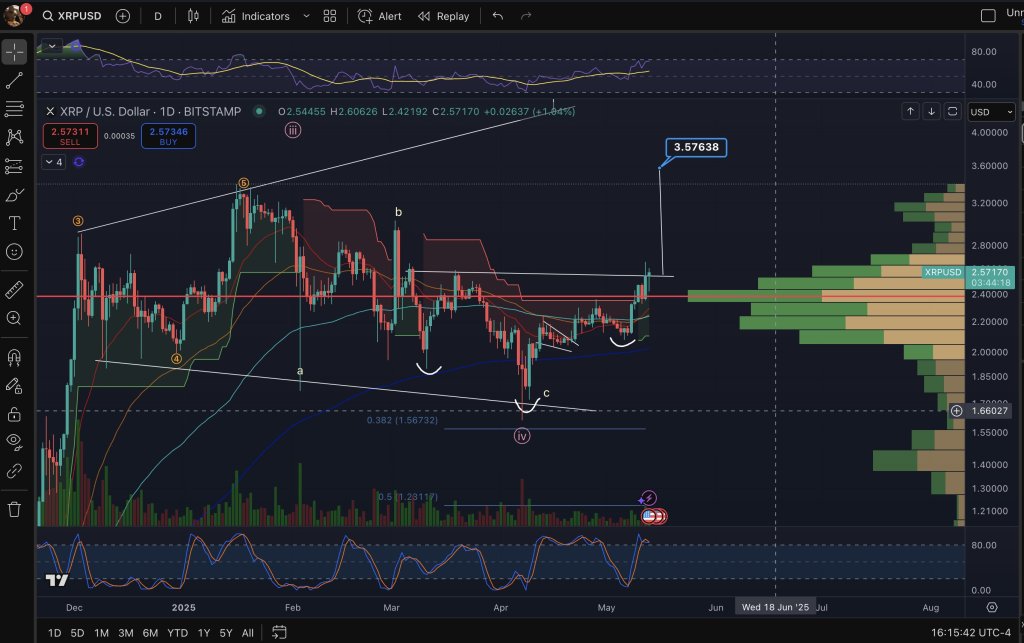
The thrust completes an inverted head-and-shoulders that formed inside wave (iv) of a larger five-wave advance. The April swing low almost tagged the 0.382 Fibonacci retracement of the entire November-to-February impulse at $1.56732; wave “c” of that corrective leg created the pattern’s head, with symmetric shoulders in mid-March and early-May. Measured-move arithmetic from the formation’s $0.80 depth projects approximately $3.58—Big Mike boxes the target at $3.57638, exactly where the white arrow terminates on his chart and where the dashed vertical line identifies Wednesday, 18 June 2025 as a plausible time window.
Market-profile data on the right flank strengthen the case: the heaviest volume node (green and tan bars) sits between $2.30 and $2.50, meaning the breakout thrust has already cleared the zone of greatest historical order flow. Above $2.80 the profile thins dramatically, implying scant overhead supply until the prior cycle’s upper channel rail near $3.00 and, ultimately, the $3.57 objective.
Momentum gauges back the move. Daily RSI has reclaimed the 60-line and is rising briskly without yet entering overbought territory, while the stochastic oscillator has punched through its signal line and is accelerating toward the upper band—confirmation that impulse rather than mere short covering is at work.
Key risk markers remain below. Dashed support at $1.66027—the lower edge of the December–May broadening wedge—remains key; a failure to hold that level would invalidate the breakout thesis. Until then, the chart now offers bullish traders a classic post-neckline retest scenario, with the analyst eyeing $3.57 as the technical terminus of wave (v).
For now, XRP bulls finally have a structure that justifies optimism—and, as Big Mike notes, they did it while the rest of the market was distracted by the inclusion of Coinbase (COIN) in the S&P 500 on Tuesday.
At press time, XRP traded at $2.60.
Veteran wave technician “BigMike7335” (@Michael_EWpro) argues that the XRP token has just completed a textbook reversal on the daily chart. In a post that accompanied the chart shown below, the strategist quipped, “While you were busy being all excited about COIN being added to ES, XRP decided to breakout.” XRP Breakout Confirmed The annotated Bitstamp daily shows price clawing back to $2.5717, a 21% gain over the last seven sessions that decisively lifts the token through a six-month neckline sitting fractionally above $2.40. That horizontal barrier—coloured red on the chart—coincides with the top of a thin, downward-slanted Ichimoku cloud. Thursday’s close placed the candle not only above the Kumo but also above the 50-day EMA (orange), the 100-day EMA (aqua) and the 200-day SMA (dark blue), stacking the moving-average ribbon in a classic bullish configuration. The thrust completes an inverted head-and-shoulders that formed inside wave (iv) of a larger five-wave advance. The April swing low almost tagged the 0.382 Fibonacci retracement of the entire November-to-February impulse at $1.56732; wave “c” of that corrective leg created the pattern’s head, with symmetric shoulders in mid-March and early-May. Measured-move arithmetic from the formation’s $0.80 depth projects approximately $3.58—Big Mike boxes the target at $3.57638, exactly where the white arrow terminates on his chart and where the dashed vertical line identifies Wednesday, 18 June 2025 as a plausible time window. Related Reading: XRP Target Could Be $15 If This Pattern Is In Play, Analyst Says Market-profile data on the right flank strengthen the case: the heaviest volume node (green and tan bars) sits between $2.30 and $2.50, meaning the breakout thrust has already cleared the zone of greatest historical order flow. Above $2.80 the profile thins dramatically, implying scant overhead supply until the prior cycle’s upper channel rail near $3.00 and, ultimately, the $3.57 objective. Momentum gauges back the move. Daily RSI has reclaimed the 60-line and is rising briskly without yet entering overbought territory, while the stochastic oscillator has punched through its signal line and is accelerating toward the upper band—confirmation that impulse rather than mere short covering is at work. Related Reading: XRP Chart Hits Critical Level That ‘Opens The Sky,’ Analyst Warns Key risk markers remain below. Dashed support at $1.66027—the lower edge of the December–May broadening wedge—remains key; a failure to hold that level would invalidate the breakout thesis. Until then, the chart now offers bullish traders a classic post-neckline retest scenario, with the analyst eyeing $3.57 as the technical terminus of wave (v). For now, XRP bulls finally have a structure that justifies optimism—and, as Big Mike notes, they did it while the rest of the market was distracted by the inclusion of Coinbase (COIN) in the S&P 500 on Tuesday. At press time, XRP traded at $2.60. Featured image created with DALL.E, chart from TradingView.com XRP News, xrp, xrp news, XRP Price, XRP Price Analysis, XRP price news, XRP Technical Analysis NewsBTC